Context
The client, a US 501(c)(3) science-education nonprofit, runs fundraising on Salesforce NPSP and Looker. The data existed, but the numbers did not agree: anniversaries, active sponsors, newsroom content, and per-sponsor views lived in different reports. The development director, the executive director, and the board could each open a dashboard and see a different number.
Constraint
The system had to survive the principal leaving. A volunteer tech team needed to extend it in code, and every metric had to be defined once. The answer was a governed LookML semantic layer, not another dashboard.
What changed
- One semantic layer: each metric is defined once in LookML; every dashboard reads the same definition.
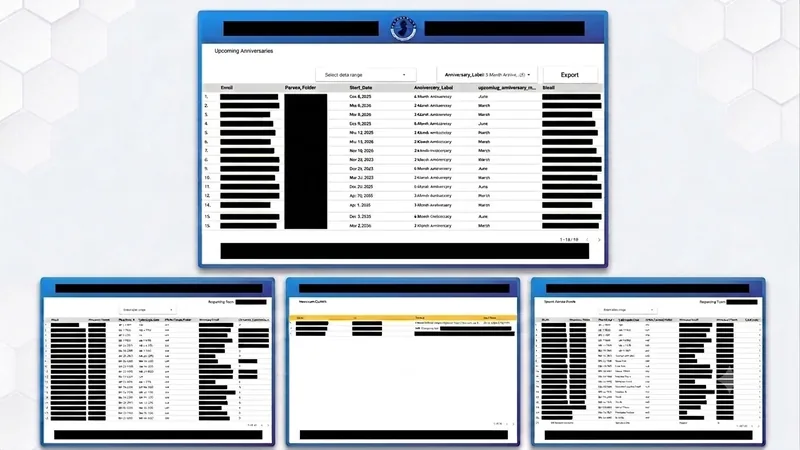
- Four production dashboards: incoming anniversaries, active sponsors, newsroom content, and a per-sponsor view the relationship team opens every Monday.
- RAG at write time: pipelines and agents clean and enrich the underlying data before it reaches the semantic layer.
- Volunteer handoff: the team owns the LookML, not a black-box vendor setup.
Evidence
The public artifact is a redacted Looker screenshot: every email, person, team, and identifying URL is removed; the dashboard structure, counts, and date column remain. That is deliberate: the proof is that the system is real, not that a donor list is public.
Lesson
Nonprofits do not need more dashboards. They need one number that the development director, the ED, the board, and the auditor can all defend. The semantic layer is the product; the dashboards are views of it.
What this means for a peer
If two teams can produce two different numbers for the same metric, you have a governance problem, not a reporting problem. Fix the definition before you add another chart.